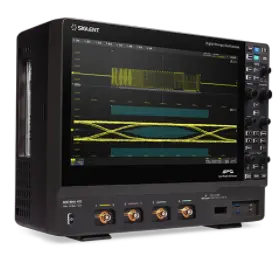
The Bode plot was invented in 1930 by Dutch-American scientist Hendrik Wade Bode. This simple yet accurate method graphically characterizes gain and phase. Bode plots are commonly used for analyzing system frequency response characteristics. In AC signal processing circuits, signal frequencies may range from Hz to kHz and even MHz levels, and voltage gain may vary from a few times to over a million. Bode plots allow these wide variations to be clearly represented on a single set of logarithmic axes.
Scenarios
Power Loop Analysis
System Frequency Response Analysis
PSRR Measurement
Solution
SIGLENT Technologies’ Bode plot solution, with the SAG1021I USB function/arbitrary waveform generator, achieves precise yet cost-effective measurement of power supply control loop response.